DSS Model
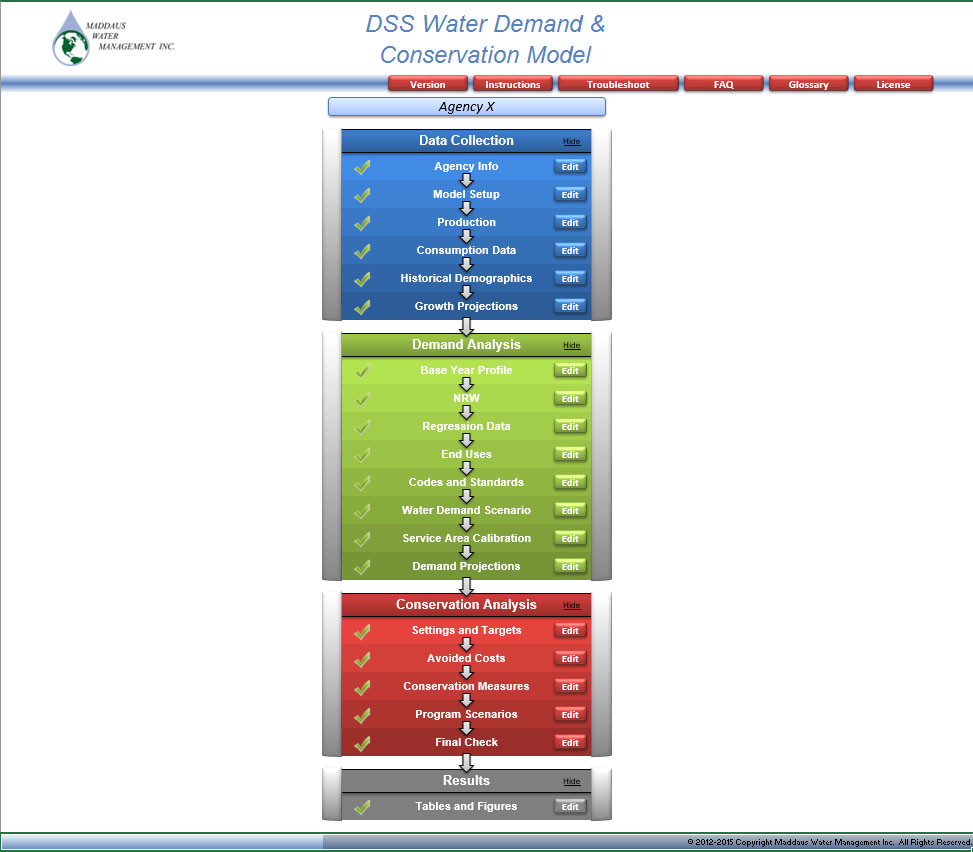
The DSS Model prepares long-range, detailed demand projections. The purpose of the extra detail is to enable a more accurate assessment of the impact of water efficiency programs on demand. A rigorous modeling approach is especially important if the project will be subject to regulatory or environmental review.
The DSS Model is an end-use model that breaks down total water production (water demand in the service area) to specific water end uses. The model uses a bottom-up approach that allows for multiple criteria to be considered when estimating future demands, such as the effects of natural fixture replacement, plumbing codes, and conservation efforts. The DSS Model may also use a top-down approach with a utility prepared water demand forecast.
To forecast urban water demands using the DSS Model, customer demand data is obtained from the water agency being modeled. The demand data is reconciled with available demographic data to characterize the water usage for each customer category in terms of number of users per account and per capita water use. The data is further analyzed to approximate the split of indoor and outdoor water usage in each customer category. The indoor/outdoor water usage is further divided into typical end uses for each customer category. Published data on average per-capita indoor water use and average per-capita end use is combined with the number of water users to calibrate the volume of water allocated to specific end uses in each customer category. In other words, the DSS Model checks that social norms from end studies on water use behavior (e.g., flushes per person per day) are not exceeded.
The DSS Model evaluates conservation measures using benefit cost analysis with the present value of the cost of water saved ($/Acre-Foot). Benefits are based on savings in water and wastewater facility operations and maintenance (O and M). The figures above and to the left illustrate the processes for forecasting conservation water savings, including the impacts of fixture replacement due to plumbing codes and standards already in place.
The DSS Model has been used for practical applications of conservation planning in over 230 service areas representing 20 million people, including extensive efforts nationally in California, Colorado, Hawaii, Utah, Georgia, Florida, North Carolina, Oregon, and Ohio, and internationally in Australia, New Zealand, and Canada.
Water Audit Tool
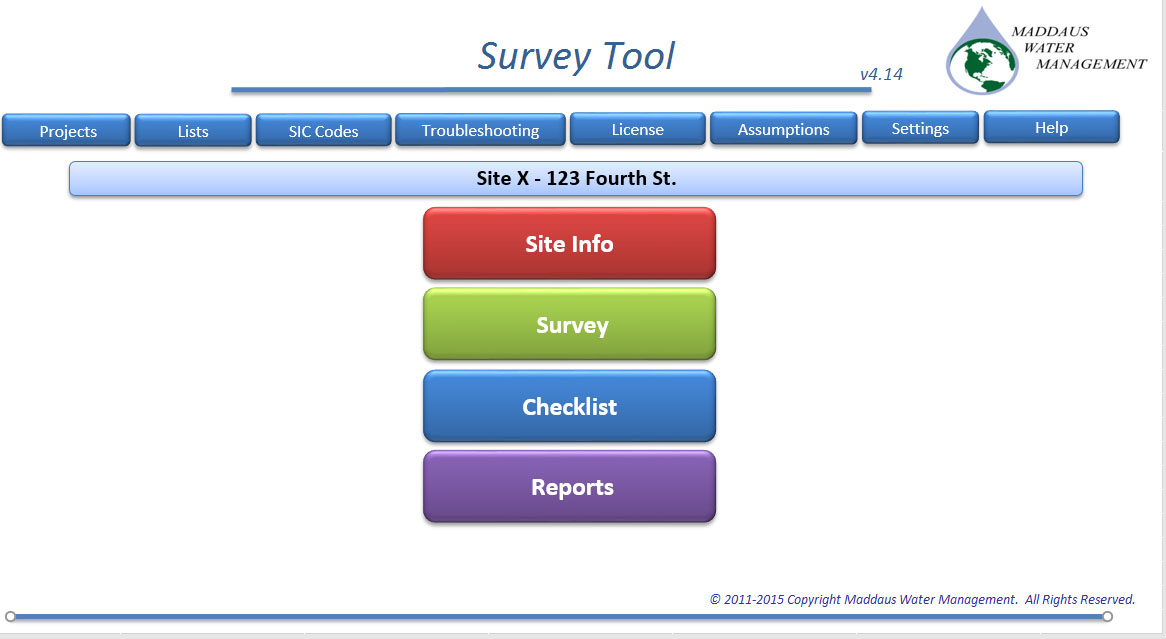
The Maddaus Water Management (MWM) Water Audit Tool electronically stores data obtained during a water survey of a commercial, institutional (university campus or hospital), or residential facility. The purpose of the electronic format is to be able to easily review data collected, review water efficiency while in the field, and have a consistent user-friendly format for an agency to store information collected during field visits. The extra detail and calculations are meant to enable a more accurate assessment of the impact of water efficiency programs.
The Water Audit Tool is an Excel-based database that allows the user to enter data about water-using equipment like flow rate, manufacturer, age, proper functioning of the unit, leakage issues, and if the unit needs replacing. Fixtures entered into the database include a wide variety of equipment, such as toilets, faucets, dishwashers, ice machines, clothes washers, pre-rinse spray valves, and irrigation fixtures. The end-use approach allows for detailed criteria to be considered when estimating future demands (e.g., the effects of natural fixture replacement, plumbing codes, and conservation efforts).
The Water Audit Tool has been designed for easy user input while in the field via a tablet or laptop computer. The screens are in a simple layout to keep the data entry to a minimum and allow the information to be entered in a time-efficient manner. The software is organized into five simple steps:
- Enter basic site data
- Select areas with water-using equipment
- Enter information from equipment/fixture
- Review list of summary data
- Review list of potential conservation projects
Step 1: Enter Basic Site Data
Figure 1 presents the opening screen where the basic data is entered for each individual water audit site. The basic data includes:- Date Audited
- Customer Billing Category
- Green Business Type
- Average Monthly Water Use
- Meter Numbers
- Date Account Opened
- Water Connection Size (inches)
- Number of Employees Working in Building
Step 2: Select Area with Water-Using Equipment/Fixture
After the basic information is entered, the water auditor can begin to enter data for specific areas or rooms in the facility. The following shows a list of possible areas that may be included in the survey. With a click of a button the user will be provided with a list of devices that might appear in one of these types of rooms.Step 3: Enter Equipment/Fixture Data
Once an area is selected, such as a restroom, the different types of fixtures related to that space will automatically appear (e.g., tank toilet, flush valve [FV] toilet, urinal, showerhead, and faucet).After a fixture type is selected, then each piece of equipment has automatically generated questions that will appear. Examples are provided below:
Step 4: Review List of Summary Data
Once the data is entered, it automatically stores in an organized database in the Water Audit Tool. The database will compile all of the toilets for the entire facility into one worksheet.Step 5: Review List of Summary Projects
In addition to the fixture data, the tool stores all of the conservation projects uncovered during the facility walk-through in one convenient location. The list of projects is provided for easy reference for reports or for reviewing the results of the audit with the customer.The Water Audit Tool has been used for practical applications of conservation planning in multiple locations, including Honolulu, Stanford University, and over 5.4 million square feet of the University of California San Francisco campus. The tool has been used by numerous organizations and utilities, including the Army Corps of Engineers, San Francisco Public Utilities Commission, City of Santa Barbara, and the City of Abbotsford in British Columbia, Canada. Drought Simulator
Shared Vision Planning Process for Defining Drought Scenarios
Understanding drought risk and mitigation options is essential to water shortage contingency planning with scenario planning to determine the worst case boundary conditions under which a utility or organization may be forced to operate. As part of the planning process, it is necessary to define the extent to which supplies can be optimized under shortage conditions. It is also important to monitor the supply system input and demand reductions during water shortages. Because water shortages generally, and droughts specifically, can be defined in so many ways given the causes (lack of supply) and the effects (adverse impacts to water users), it is critical that a utility have a mechanism to clearly model, measure, and monitor the impacts. To this end, Maddaus Water Management, works with the utility’s staff to develop a “water balance” based Drought Model. Key drought model inputs that can be incorporated include: • Contract agreements, including scenarios for cutback • Operating rules for wells under shortage conditions • Drought-staged actions for demand reduction
The figure below is one example of a simulation model that tests supply optimization between potable and non-potable surface supplies and back-up groundwater resources against demand reductions to project water shortages under different supply scenarios. The purpose of this model is to allow the utility’s staff to test scenarios and the level of cutbacks needed to meet shortfalls in supply, both for planning purposes and to aid in decision making during the drought regarding when to change from one staged level of reduction to a lower one.
Figure 18. Water Shortage Simulation Model Source: Stanford University (Maddaus Water Management, 2014). This modeling approach is adapted from the traditional Shared Vision Planning process (SVP) that uses computer model aided dialogue to create scenario planning for water resources management decisions, which can include testing drought simulations with forecasted supply reliability. Note that the Stanford University model does not include climate change scenarios and starts at the decision point that comes from BAWSCA ISA. To aid in drought preparedness decision making, SVP ideally involves modeling, public participation, and collaboration among stakeholders. SVP is supported by the Army Corps of Engineers; more information on the overall SVP process is available online: http://www.sharedvisionplanning.us/.